
Our team audited 194 Indian universities across 25 states on 43 data points. The results reveal structural gaps in how these institutions show up online — gaps that directly affect student enquiries, first impressions, and institutional reputation.
178 out of 194 Indian universities score EXCELLENT on our digital presence framework.
That sounds like good news. It isn’t.
Because the same dataset reveals that nearly half of those universities have websites slow enough to lose a student browsing on mobile. That 30% don’t appear in the top 3 Google results for their own name — meaning someone else shapes the first impression. And that 18,838 Reddit posts are shaping institutional reputations in conversations most admissions offices have never seen.
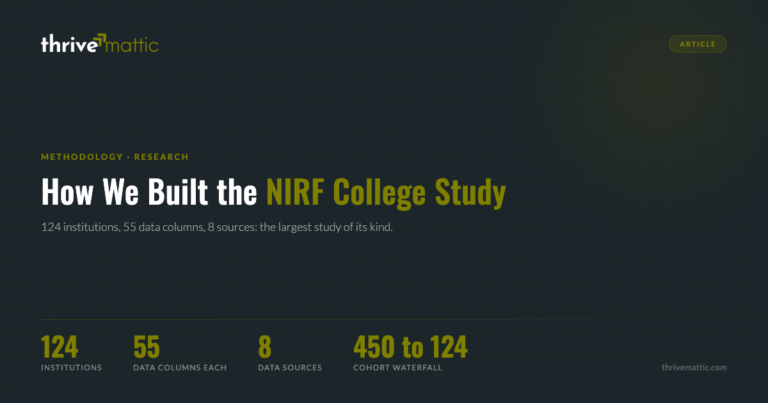
Our team analyzed 194 universities across 25 states and 43 data points per institution. We measured what prospective students actually experience: how fast pages load, how easily they find admission information, whether the university controls its own search results, how it appears in AI-powered search tools, and what current students say about it online.
This is the largest study of Indian university digital presence we are aware of. Here is what it reveals.
The Speed Crisis Hiding Behind Good Scores
The average overall website health score across 194 universities is 71.1 out of 100. That sounds respectable. Search visibility averages 82.1. Accessibility averages 77.3.
But website performance — the dimension that measures how fast pages actually load and how quickly they become usable — averages just 49.6.
That number matters more than the others. Search visibility and accessibility measure whether your site is structured correctly. Performance measures what a student experiences when they open your admissions page on a 4G connection between classes.
82 out of 194 universities (42.3%) scored below 50 on performance. Only 5 (2.6%) scored above 80.
The infrastructure behind this gap is measurable:
- Only 41.8% of universities use a content delivery network (CDN) to serve pages quickly across regions. The rest rely on a single server location.
- Only 9.3% use modern web technology. The rest run on systems built for a different era of internet use.
- The most common server software is over two decades old — reliable, but not built for the speed expectations of students browsing on mobile.
The trade-off is stark. Universities have invested in content completeness — 93.3% publish fee information, 92.8% have application forms online, 93.3% list financial aid details. The information exists. The delivery infrastructure does not match.
A prospective student browsing on their phone has a tolerance window measured in seconds. When a page takes 8+ seconds to load, it does not matter how complete the content is. They have already moved on to an aggregator platform that loads faster.
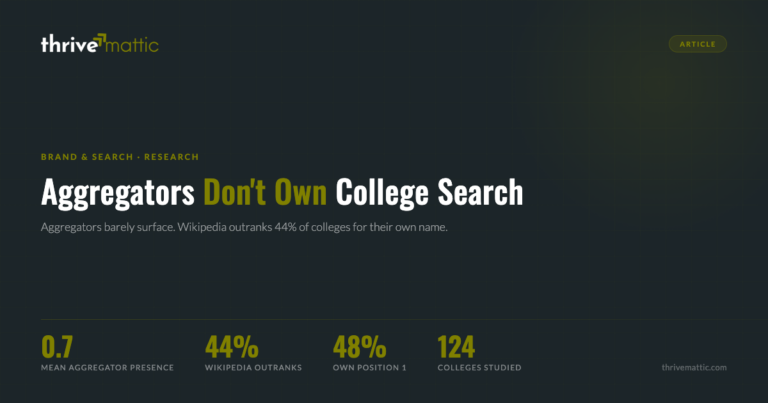
30% of Universities Don’t Own Their Own Google Results
We analyzed search result data for 190 universities. 57 of them — 30% — do not appear in the top 3 Google results when someone searches their name.
The gap varies by institution type, but the pattern is consistent: a significant share of universities have lost control of the first impression a prospective student gets when searching for them.
The combined picture: for a large share of Indian universities, the first impression a student gets is narrated by someone other than the institution.
This is not a visibility problem. These universities are visible. The problem is who controls the narrative — and whether a prospective enquiry ever reaches your own website.
18,838 Reddit Posts Most Admissions Offices Haven’t Read
We collected and analyzed 18,838 posts across 10+ education communities on Reddit. 185 out of 194 universities (95.4%) are being actively discussed by students and parents on the platform.
The average sentiment score: 60.3 out of 100.
108 universities have positive sentiment. 71 have mixed. 6 have negative.
The universities with positive sentiment are not there because of reputation management. They are there because students report genuine outcomes — placements that matched promises, faculty who responded, infrastructure that worked.
The universities with mixed or negative sentiment are not being attacked. They are being accurately described by their own students.
Most admissions and communications teams do not monitor these conversations. Of the ones that do, few have a framework for turning what students are saying into operational improvements.
AI Search Is Already Shaping Student Decisions
We queried AI search tools about each of the 194 universities and measured how they are represented.
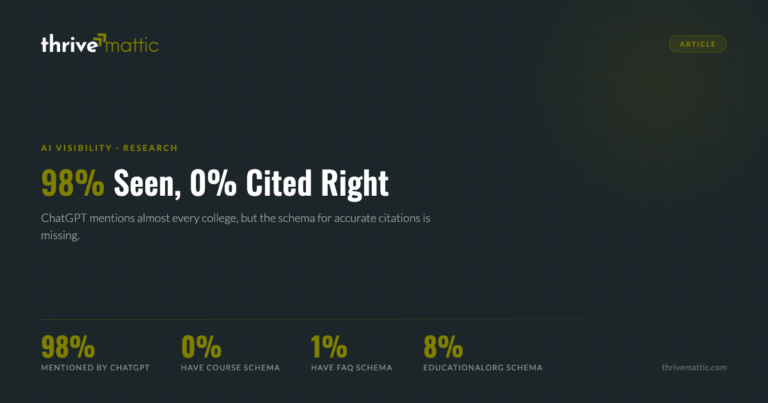
The average AI Visibility Score is 88.6 out of 100. Nearly 96% of universities are mentioned when asked about directly. That appears strong.
But 8 universities — 4.1% — have no AI presence at all. They are invisible to the fastest-growing way prospective students research institutions.
More critically, being mentioned is not the same as being accurately represented. Universities with detailed, well-structured website content get nuanced AI responses. Universities with thin content get generic descriptions — or worse, inaccurate ones drawn from third-party platforms.
Students are increasingly using AI tools like ChatGPT and Perplexity to build shortlists before they ever visit a university website. The quality of how your institution appears in those answers is already a competitive factor — not a future one.
Three Gaps That Define the Competitive Landscape
Across 194 universities and 43 data points, the gaps consolidate into three categories:
Gap 1: Speed vs. Compliance. Websites pass structural health checks but fail the one test students feel — how fast the page loads. This is an infrastructure problem, not a content problem. The fix is technical: better hosting, image optimization, and modern delivery infrastructure. The return is direct: faster pages mean fewer students leaving before they see your admissions page.
Gap 2: Brand vs. Aggregator. 30% of universities have ceded their search narrative to third-party platforms. Every student who forms a first impression from an aggregator page is a potential enquiry that may never reach your website. Reclaiming those positions requires sustained effort — stronger website content, better search optimization, and active management of your Wikipedia and social profiles.
Gap 3: Narrative vs. Reality. 18,838 Reddit posts reveal what students actually experience. The institutions with positive sentiment are not running reputation campaigns — they are delivering on promises. For institutions with mixed sentiment, the gap between the marketing message and the student experience is the root cause. No amount of content marketing addresses a delivery problem.
The sequence matters. Gap 1 is the fastest to close — it is an infrastructure decision, not a strategy overhaul. Gap 2 requires sustained effort but has measurable checkpoints. Gap 3 is the hardest because it requires operational change, not just marketing change.
What This Means for University Leaders
This research does not tell any university something they cannot discover about themselves. Every data point we collected is technically available.
What it provides is context. Where your institution sits relative to 193 peers. Which gaps are structural and which are cosmetic. Where to invest first for the highest impact on student enquiries, applications, and enrollment outcomes.
The institutions that address these gaps first will have a measurable advantage. Not because they will have better brochures, but because their websites will load before the student moves on, their search results will tell their own story, and their reputation will be shaped by their own content rather than by aggregator platforms and student forums.
The window is open. When enough institutions close these gaps, the benchmark moves — and the advantage shifts from early movers to table stakes.
This is Part 1 of a 12-part series based on Thrivemattic’s 194-university digital presence research. Deep dives into website performance, SERP brand protection, Reddit sentiment, AI visibility, and admissions journey are linked from the full research overview.
We have individual reports for each of the 194 universities, showing your scores across all dimensions, how you compare to peer institutions, and where the highest-impact actions should begin. If you want a university-specific view, request your report from Find Your University’s Digital Ranking.